Infographics on refugees, militarization, arms transfers
These are archived versions of the infographics described in our Aug. 5, 2016 blog post on “Refugees, arms transfers, and militarization”.
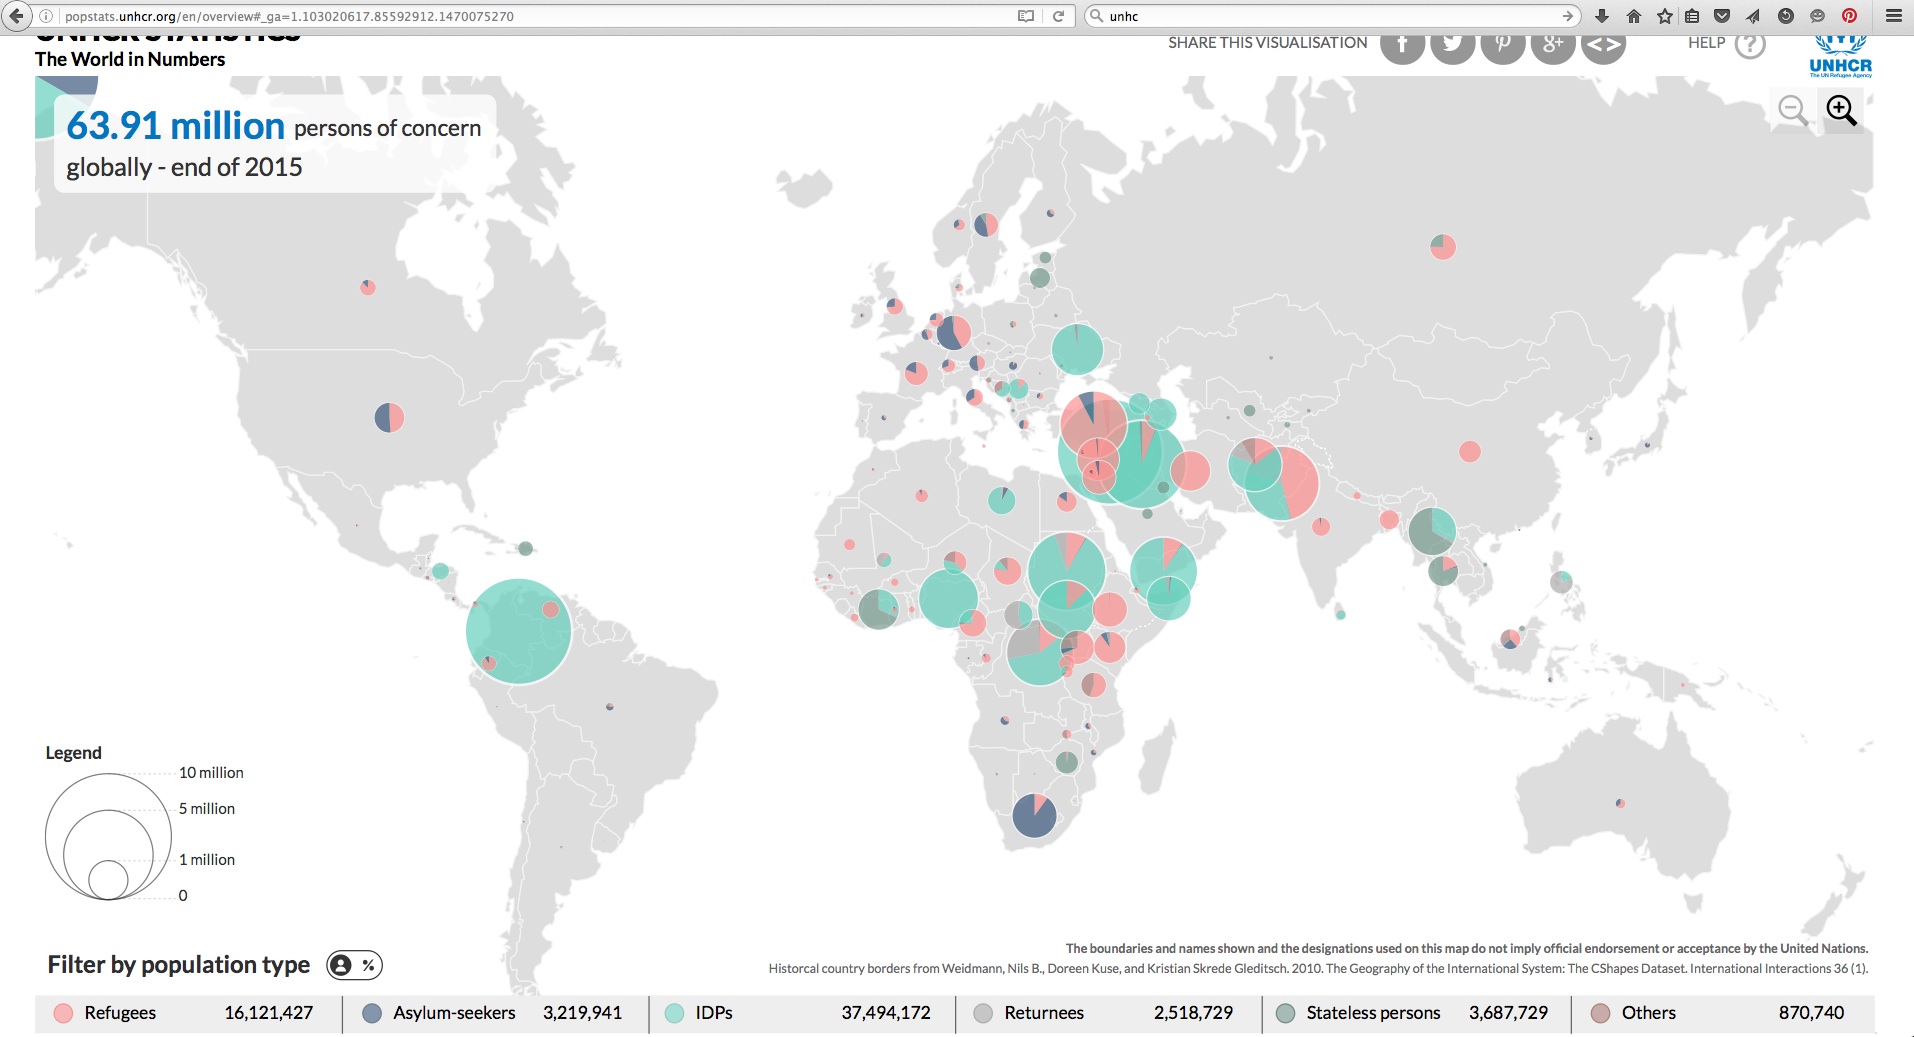
This is a static version of the very informative interactive map the UN High Commission on Refugees (UNHCR) has published on the situation of the world’s refugees in 2016. Click here to go to the interactive version. Presumably, they’ll be updating it at least annually?
This is a UNHCR graphic that mentions the Palestinian refugees.
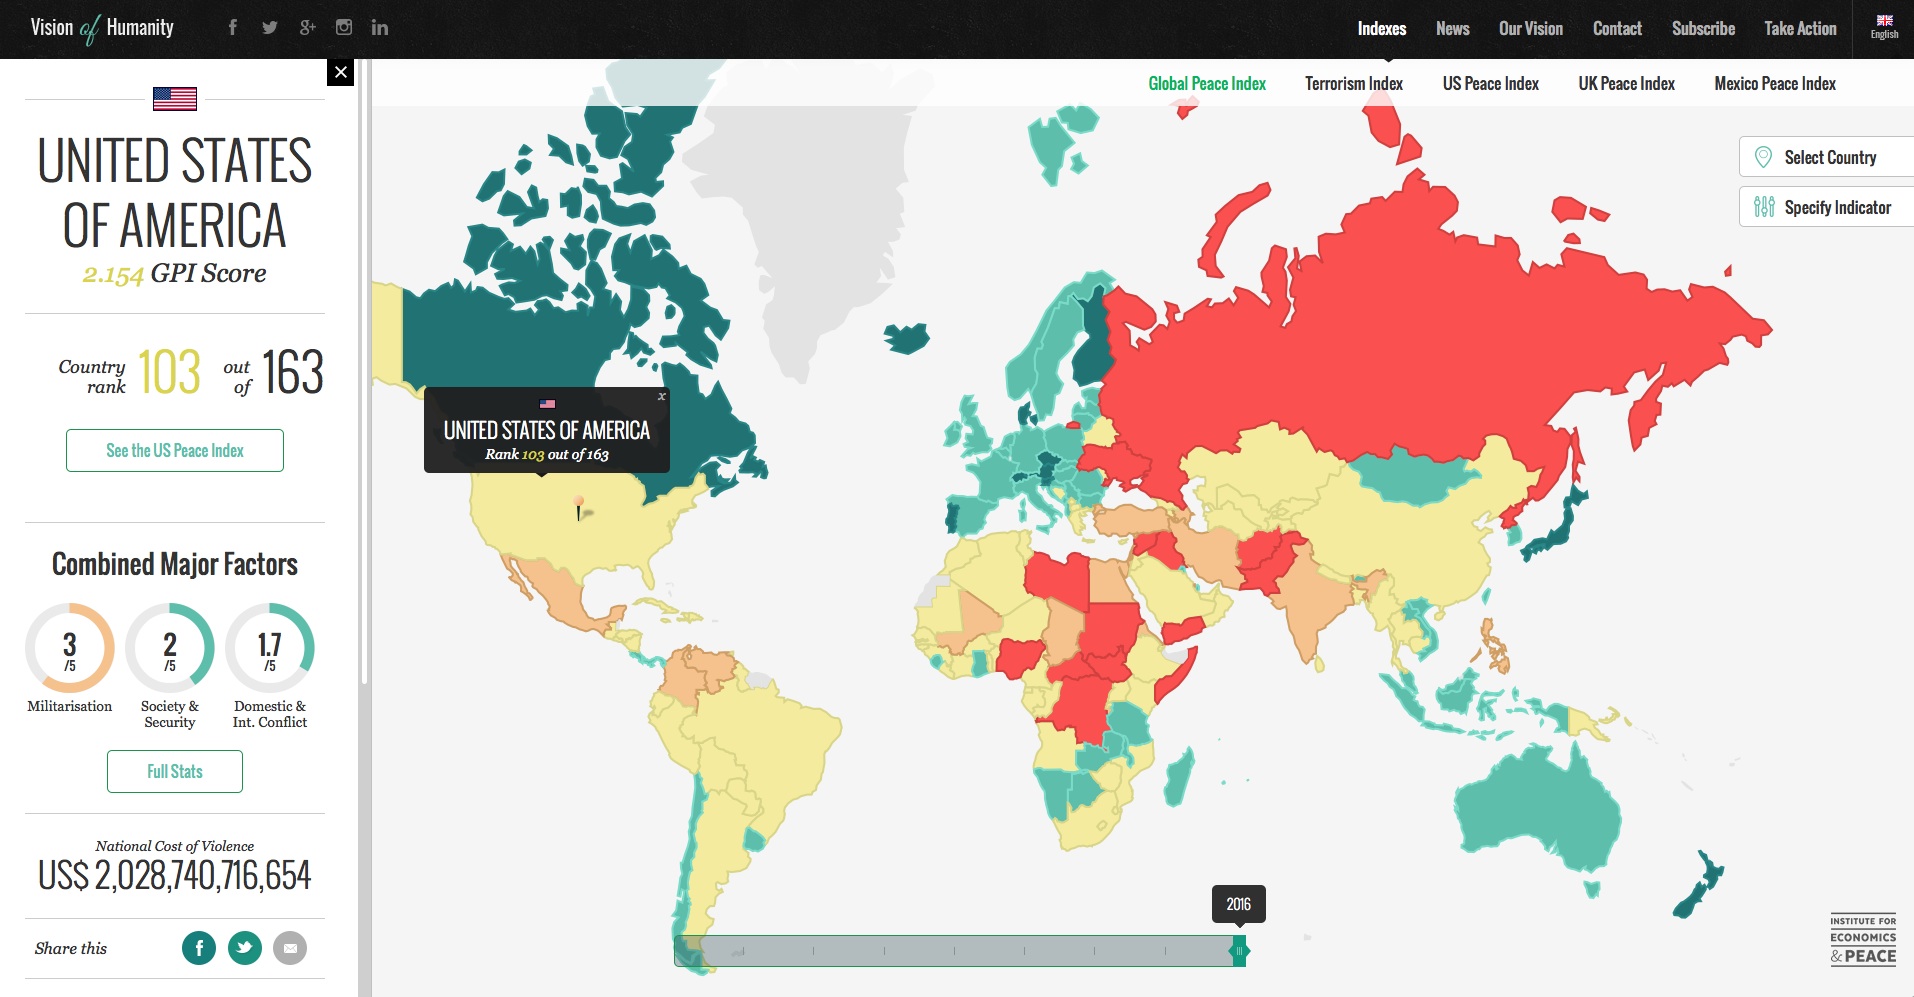
Here is a static grab (early August 2016) from the amazing, interactive tool related to the levels of militarization of all the world’s countries, that is published by the Institute for Economics and Peace.
The Institute for Economics and Peace’s Global Peace Index 2016 report (PDF) has this graphic on p.42 that pegs the annual economic cost of inter-state and intra-state violence at $13.6 trillion.

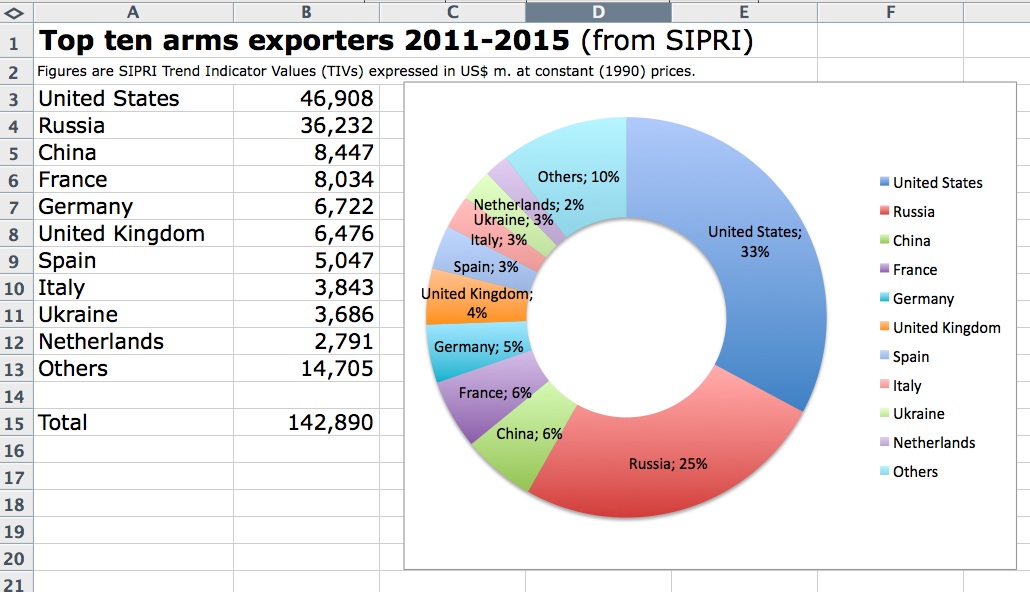
The venerable Stockholm International Peace Research Institute (SIPRI) has been compiling and publishing data on arms transfers since 1950. This is a primitive graphic we produced from data in the amazing online database they have on this topic.